This post is also available in: Russian
The Project home page.
0.Installation
- Download dataflow-0.3.0.zip archive
- Unpack it anywhere (c:/temp, for example )
1.Configuration
- Rename dataflow.cfg.example to dataflow.cfg
- If the tool is unpacked to a directory other than c:/temp, change the path in dataflow.cfg
2.Start
Launch DataflowManager.exe binary. Smile icon should appear in the tray.
Open cmd.exe. Go to c:/temp (or another installation directory)
cd c:/temp
c:
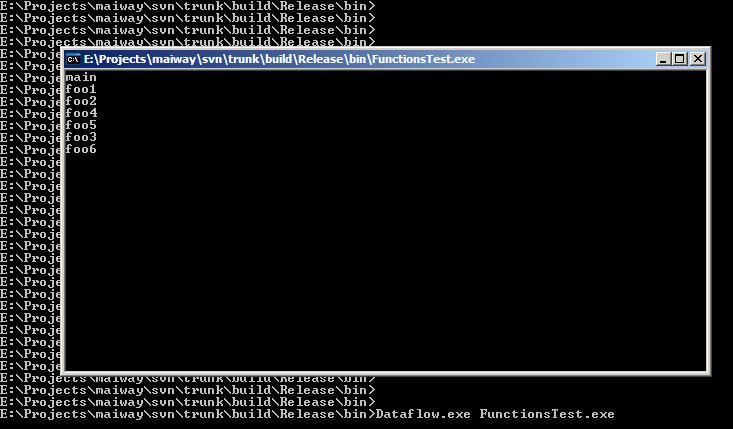
Start example program analysis (FunctionsTest.exe).
Dataflow.exe FunctionsTest.exe
FunctionsTest.exe binary is compiled by cl from source code listed below:
#include ;
#include "stdafx.h"
int foo5( void )
{
    printf( "foo5\n" );
    return 0;
}

int foo6( void )
{
   printf( "foo6\n" );
   return 0;
}

int foo4( void )
{
   printf( "foo4\n" );
   return 0;
}

int foo3( void )
{
   printf( "foo3\n" );
   foo6();
   return 0;
}

int foo2( void )
{
   printf( "foo2\n" );
   foo4();
   foo5();
   return 0;
}

int foo1( void )
{
   printf( "foo1\n" );
   foo2();
   foo3();
   return 0;
}

int main(int argc, char* argv[])
{
   printf( "main\n" );
   foo1();
   getchar();
   return 0;
}
After start the utility stops on getchar() operator
Program is still running.
Utility analysis data can be requested using control utility.
Debug information should appear in tool console. Two matrixes are dumped: reachability and connectivity matrixes.
FunctionsTest.exe static and dynamic analysis data is stored in FunctionsTest.exe [time date] (PID) disk directory.
Analysis data can be requested any time. Data is stored in a separate directory with name containing request number.
Each directory contains two files.
Functionstest.exe_boundle.gdl file contains analyzed binaries information: executable modules, function call graphs, function CFG, code coverage data.
Functionstest.exe_fuzzing.gdl file contains functions rating related to fuzzing.
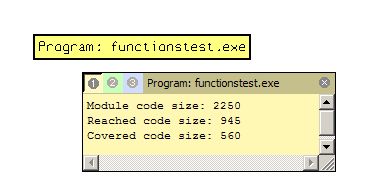
Let’s explore functionstest.exe_boundle.gdl file in detail. The file contains description in GDL language format. It can be opened by aiSee (www.aiSee.com). Let’s open functionstest.exe_boundle.gdl file with aiSee utility (it is useful to associate .gdl extension with aiSee). The higher level information is displayed. Choose block and press “I” key. Module information is displayed.
Module code size – number of program code bytes (only modules from dataflow.cfg are taken into account). The value calculated as module’s executable sections size sum.
Reached code size – code bytes amount achieved during static analysis (by functions calls). Only modules form dataflow.cfg are taken in account.
Covered code size – code bytes amount that were executed during dynamic analysis. Only modules form dataflow.cfg are taken in account.
Unfold Program:functionstest.exe block to get more detailed information. Choose block and press “b” key. (Unfold).
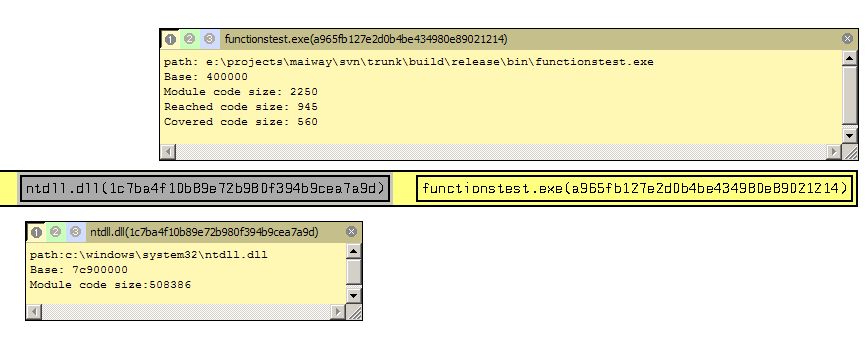
The scheme changed to module level visualization. Four modules have been loaded during program execution: msvcr100.dll, kernel32.dll, ntdll.dll, functionstest.exe. File path checksums were added to modules names to prevent name collisions. Zoomed graph parts are shown below.
Analyzed modules (whitch were listed in dataflow.cfg) are highlighted with yellow. Only functionstest.exe module interests us. Other modules have not been analyzed and are marked with gray. Choose module block and press “I” to get module information.
Module information is given: full image path, base address, executable code statistic. Felds have same meaning as in program descripting. Fields values for module are the same because only one module was analyzed. Reached code size and Covered code size fields are absent for modules which were not analyzed (filled with grey color).
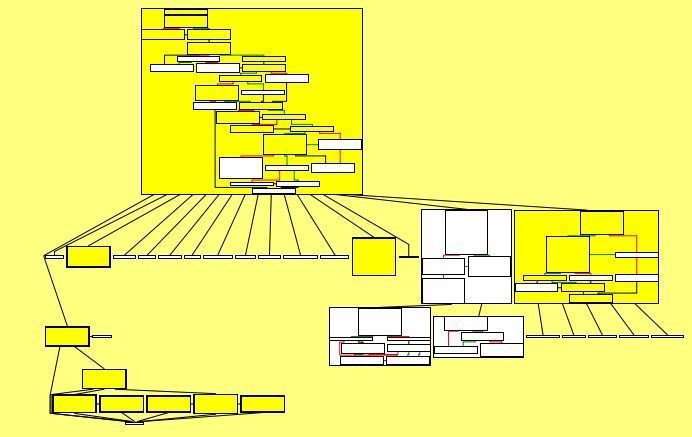
The next detail level is module’s functions. Choose functionstest.exe module block and press “X” key (Exclusive subgraph). Then press “M” key (Fit to Window). Now module call graph is shown.
Let’s explore picture parts. Central part contains EntryPoint function – module entry point.
Right graph part contains program’s initialization code functions.
Finally, left part contains functions from source code listed above.
Functions that were executed are highlighted with yellow. Functions that were not executed are colored with white.
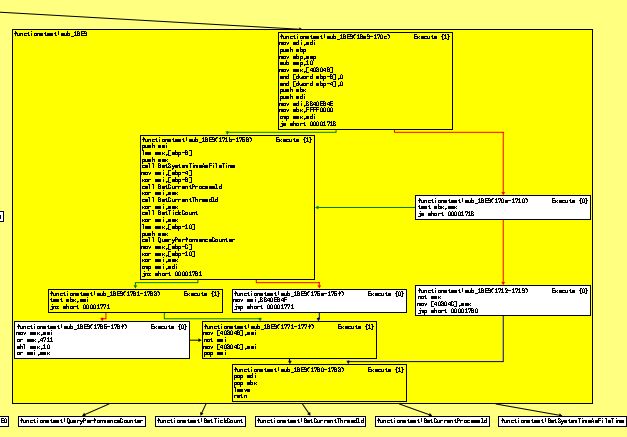
Next detail level – function code. Choose functionstest.exe!sub_16E9 block and press “b” key (unfold to box). Function code blocks are shown.
We chose functionstest.exe!sub_16E9 automatically generated function because it contains many code blocks and gives good illustration. Functions from source code are more trivial.
Thus, we can explore any program parts moving through detail levels. The following keys are used:
”b” – unfold to block
“f” – fold block
“x” – exclusive subgraph
“Shift+X” – fold subgraph
Finally, let’s see the whole unfolded program graph.
Let’sexplore functionstest.exe_fuzzing.gdl file in details. File contains information useful for fuzzing entry point choosing. Open file in aiSee. Program detail level is shown. Nothing changed from this detail level from functionstest.exe_fuzzing.gdl. Modules detail level is the same too.
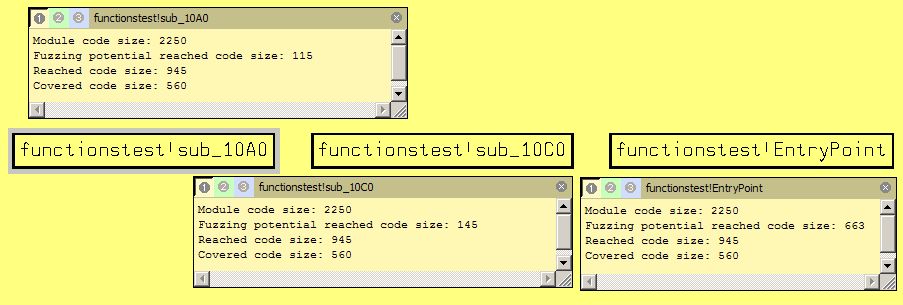
Changes appear in functions detail level. Functions rating related to fuzzing shown here instead functions call graph. Functions are sorted by rating increase from left to right. Function is more rated if more functions can be reached from it. Three most rated functionstest.exe module functions are shown below.
Module code size, Reached code size and Covered code fields relate to function’s module. They are shown to compare them with fuzzing potential reached code size.
Fuzzing potential reached code size field indicates maximum code amount that can be covered during fuzzing from this function.
Graphical view is also available for reached code. Choose functionstest.exe!EntryPoint function in rating and press “b” button. Functions calls graph are shown. It looks like functions calls graph from functionstest.exe_boundle.gdl .
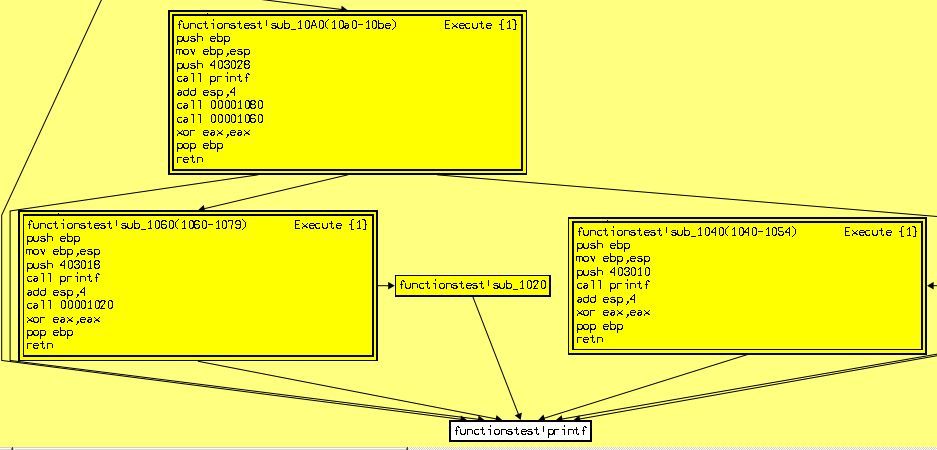
Borders of functions that can be covered from the selected point are colored by red. All borders in graph are red because module’s entry function is selected (functionstest.exe!EntryPoint). Functions from source code listed above and auto generated code can be covered from this point. Let’s shift to less rated function (functionstest.exe!sub_10A0).
Fewer functions from graph can be reached from this point, but automatic generated code is excluded. All functions form source code listed above can be reached.
1. Переименуйте dataflow.cfg.example в dataflow.cfg
2. Если вы распаковали в отличную от c:/temp директорию, то измените путь на соответствующий








 English
 Русский
Thanks for replay.