This post is also available in: Russian
The Project home page.
Some useful information you can see in Dataflow 0.1.1 Tutorial.
0.Installation
- Download dataflow-0.3.0.zip archive
- Unpack it anywhere (c:/temp, for example )
1.Configuration
- Rename dataflow.cfg.example to dataflow.cfg
- If the tool is unpacked to a directory other than c:/temp, change the path in dataflow.cfg
2.Start
Launch DataflowManager.exe binary. Smile icon should appear in the tray. Open cmd.exe. Go to c:/temp (or another installation directory)
cd c:/temp c:
Start example program analysis (FunctionsTest.exe).
Dataflow.exe FunctionsTest2.exe
FunctionsTest.exe binary is compiled by cl from source code listed below:
#include <stdio.h>
#include "stdafx.h"
int foo5( void )
{
   printf( "foo5\n" );
   return 0;
}

int foo6( void )
{
   printf( "foo6\n" );
   return 0;
}

int foo4( void )
{
   printf( "foo4\n" );
   return 0;
}

int foo3( void )
{
   printf( "foo3\n" );
   foo6();
   return 0;
}

int __stdcall foo2( int a, int b, int c, int d )
{
   printf( "foo2\n" );
   printf( "a: %i, b: %i, c: %i, d: %i\n", a, b, c, d );

   foo4();

   foo5();

   return 0;
}

int __fastcall foo1( int a, int b, int c, int d )
{

   printf( "foo1\n" );

   printf( "a: %i, b: %i, c: %i, d: %i\n", a, b, c, d );

   foo2( 13, 24, 35, 46 );

   foo3();

   return 0;
}

int main(int argc, char* argv[])
{
   goto start;

   getchar();

start:
   __asm
   {
      mul ebx;
      jmp nogetch;
   }
   getchar();

nogetch:

   printf( "main\n" );

   foo1( 12, 23, 34, 45 );

   do
   {
   } while( 1 );
   return 0;
}
After start the utility stops on infinity loop  The program is still active. Utility analysis data can be requested using control utility.
  FunctionsTest.exe static and dynamic analysis data is stored in FunctionsTest.exe [time date] (PID) disk directory.
  Analysis data can be requested any time. Data is stored in a separate directory with name containing request number.
  Each directory contains some files.
  Functionstest.exe_boundle.gdl file contains analyzed binaries information: executable modules, function call graphs, function CFG, code coverage data. Functionstest.exe_fuzzing.gdl file contains functions rating related to fuzzing. Include file module_name.h has generated for each loaded module. This file contains recovered functions prototypes and its addresses. This is part of functionstest2.h:
int ( __stdcall *functionstest2_sub_10C0__)( int c, int d )
   = ( int ( __stdcall * ) ( int c, int d) ) 0x4010c0;

inline int __stdcall functionstest2_sub_10C0( int a,
                                                               int b,int c,int d )
{
   __asm{
      mov ECX, a
      mov EDX, b
   }
   return functionstest2_sub_10C0__( c, d );
}

int ( __stdcall *functionstest2_sub_1080__)( int a, int b, int c, int d )
      = ( int ( __stdcall * ) ( int a, int b, int c, int d) ) 0x401080;

inline int __stdcall functionstest2_sub_1080( int a, int b,int c,int d )
{
   __asm{
   }
   return functionstest2_sub_1080__( a, b, c, d );
}
It is important that this include file is common module function in memory fuzzing SDK. The sample above gives functions functionstest2_sub_10C0 and functionstest2_sub_1080 prototypes. To choose fuzzing entry point someone can use functionstest.exe_fuzzing.gdl file data. The file contains description in GDL language format. It can be opened by aiSee (www.aiSee.com). Let’s open functionstest.exe_boundle.gdl file with aiSee utility (it is useful to associate .gdl extension with aiSee). The higher level information is displayed. Choose block and press “I” key. Module information is displayed.  Module code size – number of program code bytes (only modules from dataflow.cfg are taken into account). The value calculated as module’s executable sections size sum. Reached code size – amount of code bytes achieved during static analysis (by functions calls). Only modules form dataflow.cfg are taken in account. Covered code size – amount of code bytes that were executed during dynamic analysis. Only modules form dataflow.cfg are taken in account. Unfold Program:functionstest.exe block to get more detailed information. Choose block and press “b” key. (Unfold).
  Analyzed modules (whitch were listed in dataflow.cfg) are highlighted with yellow. Only functionstest.exe module interests us. Other modules have not been analyzed and are marked with gray. Next level gives important information about module – functions rating related to fuzzing. Press “b” for moving to this level. The more rated functions are at right side of screen.
 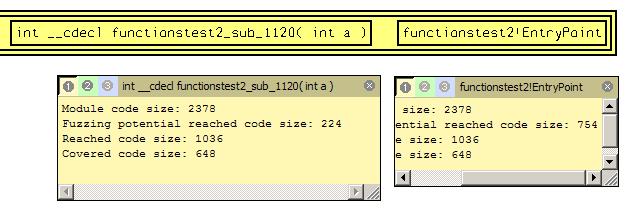 Obvious, code coverage starting from entry point is the most biggest one ( see Fuzzing potential reached code size parameter ). It is because all module functions are potentially reachable from the entry point. Reachable functions are shown red in the picture below.
  However entry point doesn’t get any parameters (parameters are not used). Let’s move to the next rated function. Such function is int __cdecl functionstest2_sub_1120( int a ). It covers less amount of code, but all functions from source shown above can be reached.
  Function is the best in respect to code coverage. Are its parameters suitable for fuzzing? Additional information panel exists that gives such information. Press “i” to show this panel.
 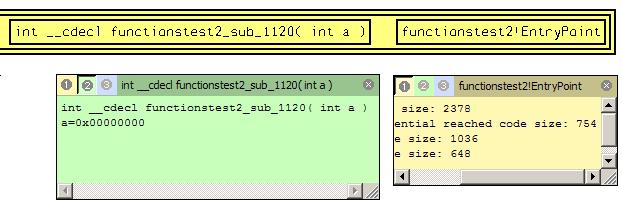 Here is recovered function prototype and parameters values passed to function while execution. One values set for each call is recorded. The function was called once and only one parameters set was logged. There is only one parameter with zero value. Let’s see disassembled listing to understand parameter using. Open functionstest.exe_boundle.gdl file and search interested function.
 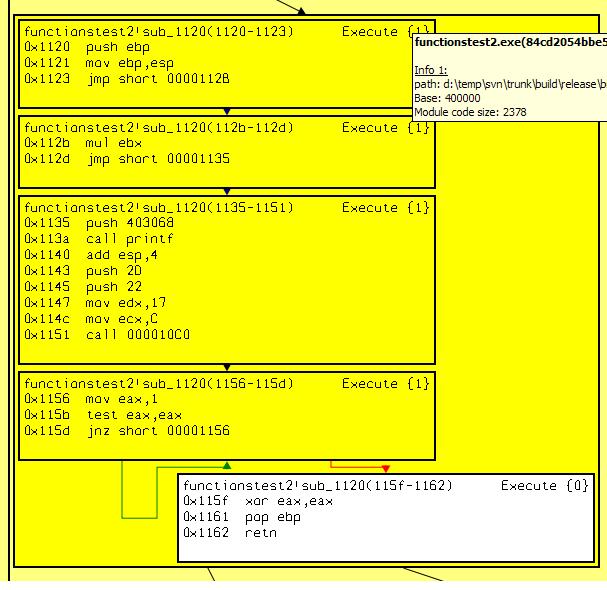 Parameter passing approach need to be defined. functionstest2.h file contains such information.
int ( __cdecl *functionstest2_sub_1120__)( void )
    = ( int ( __cdecl * ) ( void) ) 0x401120;

inline int __cdecl functionstest2_sub_1120( int a )
{
   __asm{
      mov EBX, a
   }
   return functionstest2_sub_1120__( );
}
Someone can see that single parameter passed through ebx register and used in mul operator. Multiplication result has not been used in following code. Obviously this code is not interesting. It was placed here for demonstration of recovering parameters that passed through registers. This is functions from source:
int main(int argc, char* argv[])
{
   goto start;

   getchar();

start:
   __asm
   {
      mul ebx;
      jmp nogetch;
   }
   getchar();

   nogetch:

   printf( "main\n" );
   foo1( 12, 23, 34, 45 );
   do
   {
   } while( 1 );

   return 0;
}
This function called main. Let’s move to the next rated function. 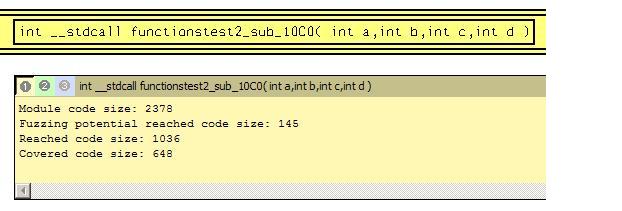 Function can cover this code:
  Function can cover the same area except functiontest2_24!sub_1120 function. Parameters information is:
 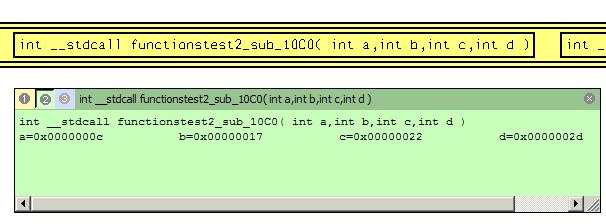 The function takes four parameters. All parameters values are numbers. This numbers are the same as in program output. It is good point for fuzzing. Make test suite that includes generated file functionstest.h.
#include "functionstest.h"
void StartTest( void )
{
   functionstest_sub_10C0( 88, 77, 66, 55 );
   functionstest_sub_1080( 33, 44, 55, 66 );
}

BOOL APIENTRY DllMain( HMODULE hModule,
                                 DWORD  ul_reason_for_call,
                                 LPVOID lpReserved
)

void StartTest( void )
{
   switch (ul_reason_for_call)
   {
      case DLL_PROCESS_ATTACH:
         StartTest();

      case DLL_THREAD_ATTACH:
      case DLL_THREAD_DETACH:
      case DLL_PROCESS_DETACH:
      break;
  }
  return TRUE;
}
Make functionstest_sub_1080 function call for demonstration purpose. It has prototype inline int __stdcall functionstest2_sub_1080( int a,int b,int c,int d ). Compile and link this code to dynamic library FuzzFunctionsTest.dll. All needed stuff for testing is ready now. Click menu item “Load Binary Test Suite”.  Find and select FuzzFunctionsTest.dll file in opened dialog. Library is loaded to analyzed program’s address space. Entry point is executed. Original program’s code continues to execute after that. We can see that target functions were called with defined in source parameters.
 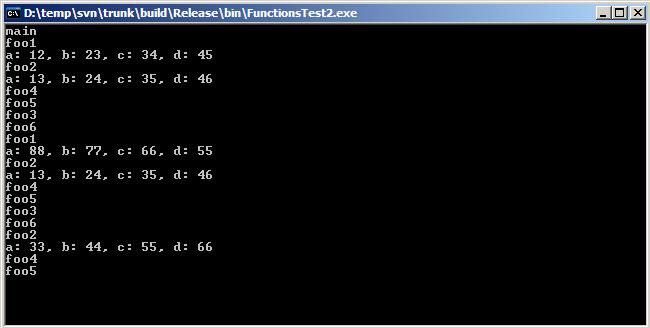 Two additional calls were executed started from foo1 and foo2. All followed functions are executed too. Execution information can be requested now again. This process can be repeated any times.
 English
 Русский